install.packages(c("shiny", "dygraphs", "xts", "httr2"))18 Live Dashboards
Here’s where everything comes together: the 3D viewer from the Viewer chapter on the left, live sensor charts from Linking Sensor Streams on the right, all in one Shiny (Chang et al. 2024) app that refreshes automatically. This is what a digital twin dashboard looks like in R.
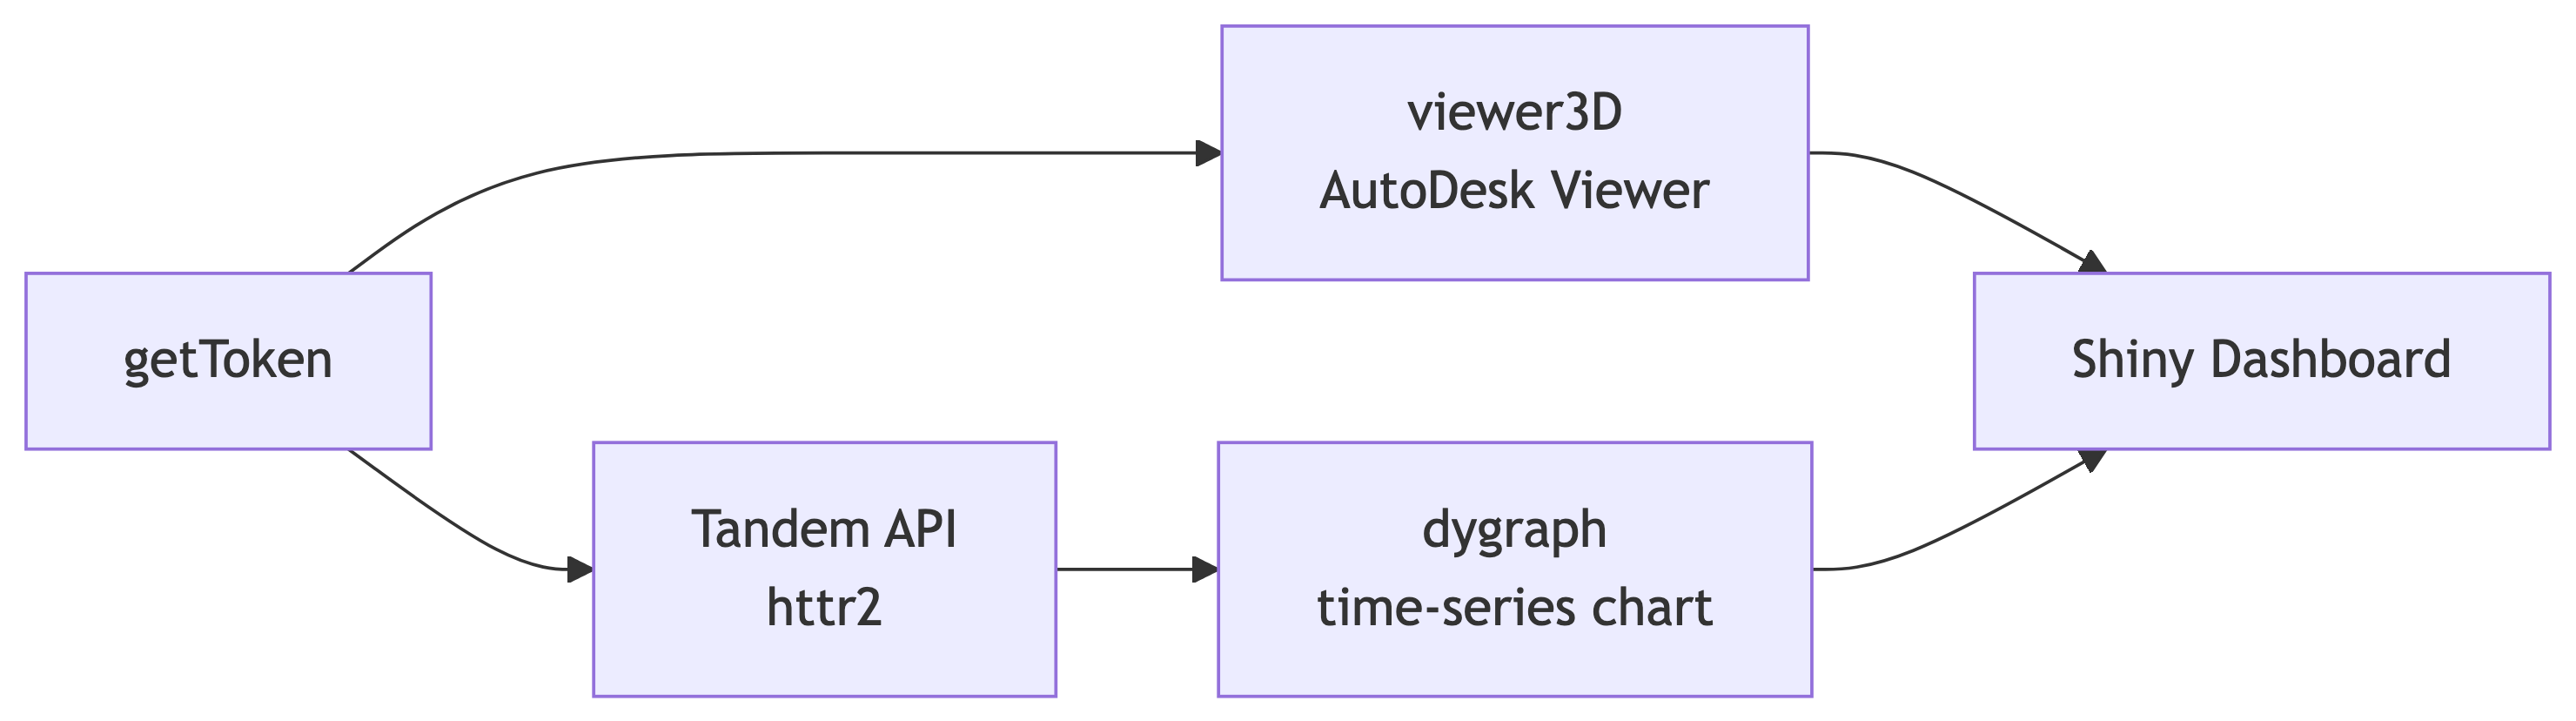
getToken authenticates both the AutoDesk Viewer (viewer3D) and the Tandem API (via httr2), whose dygraph time-series charts and 3D view feed a single Shiny dashboard.18.1 Required Packages
18.2 Helper: Fetch Stream Readings
Define a reusable function that the Shiny server calls reactively (uses httr2 (Wickham 2024) for the Tandem API calls):
library(AutoDeskR)
library(httr2)
library(dygraphs)
library(xts)
library(shiny)

get_stream_readings <- function(facility_id, stream_id, hours_back = 24) {
  token <- getToken(
    id     = Sys.getenv("client_id"),
    secret = Sys.getenv("client_secret"),
    scope  = "data:read"
  )$content$access_token

  end_time   <- Sys.time()
  start_time <- end_time - hours_back * 3600
  resp <- request(
    paste0("https://tandem.autodesk.com/api/v1/twins/",
           facility_id, "/streams/", stream_id)
  ) |>
    req_url_query(
      start = format(start_time, "%Y-%m-%dT%H:%M:%SZ", tz = "UTC"),
      end   = format(end_time,   "%Y-%m-%dT%H:%M:%SZ", tz = "UTC")
    ) |>
    req_auth_bearer_token(token) |>
    req_perform()
  readings <- resp_body_json(resp)
  data.frame(
    timestamp = as.POSIXct(vapply(readings$values, `[[`, character(1), "t"),
                            format = "%Y-%m-%dT%H:%M:%SZ", tz = "UTC"),
    value     = vapply(readings$values, `[[`, numeric(1), "v"),
    stringsAsFactors = FALSE
  )
}
18.3 App Startup
Fetch the token and stream list once, before the UI and server are defined:
myEncodedUrn <- jsonlite::base64_enc(Sys.getenv("urn"))
myToken      <- getToken(id     = Sys.getenv("client_id"),
                         secret = Sys.getenv("client_secret"),
                         scope  = "data:read")$content$access_token
facilityId   <- "urn:adsk.dtdm:facility.abc123def456"

streams_resp <- request(
  paste0("https://tandem.autodesk.com/api/v1/twins/", facilityId, "/streams")
) |>
  req_auth_bearer_token(myToken) |>
  req_perform()
streams <- resp_body_json(streams_resp)

stream_choices <- setNames(
  vapply(streams, `[[`, character(1), "id"),
  vapply(streams, `[[`, character(1), "displayName")
)
Important
Replace before running: facilityId ("urn:adsk.dtdm:facility.abc123def456") with your own Tandem facility URN, and set client_id, client_secret, and urn in ~/.Renviron.
18.4 UI Layout
Viewer on the left, controls and chart on the right:
ui <- fluidPage(
  titlePanel("Digital Twin Dashboard"),
  fluidRow(
    column(7,
      viewer3D(urn        = myEncodedUrn,
               token      = myToken,
               viewerType = "headless")
    ),
    column(5,
      selectInput("stream_id", "Sensor stream:",
                  choices = stream_choices),
      sliderInput("hours_back", "Time window (hours):",
                  min = 1, max = 168, value = 24, step = 1),
      dygraphOutput("sensor_plot", height = "320px"),
      tableOutput("stats_table")
    )
  )
)
18.5 Server Logic
A reactiveTimer polls Tandem every 60 seconds so the chart stays current without the user having to refresh the page:
server <- function(input, output, session) {

  auto_refresh <- reactiveTimer(60000)   # 60 seconds

  readings <- reactive({
    auto_refresh()   # re-run on the timer tick
    get_stream_readings(facility_id = facilityId,
                        stream_id   = input$stream_id,
                        hours_back  = input$hours_back)
  })

  output$sensor_plot <- renderDygraph({
    df   <- readings()
    ts   <- xts(df$value, order.by = df$timestamp)
    name <- names(stream_choices)[stream_choices == input$stream_id]
    dygraph(ts, main = name) |>
      dyRangeSelector() |>
      dyOptions(fillGraph = TRUE, fillAlpha = 0.15,
                drawGrid  = TRUE, colors   = "#367ABF") |>
      dyAxis("y", label = "Value")
  })

  output$stats_table <- renderTable({
    df <- readings()
    data.frame(
      Metric = c("Readings", "Mean", "Min", "Max"),
      Value  = c(nrow(df),
                 round(mean(df$value), 2),
                 round(min(df$value),  2),
                 round(max(df$value),  2))
    )
  }, striped = TRUE, bordered = TRUE, align = "lr")
}

shinyApp(ui, server)
Note
Representative result. Running this app opens a digital twin dashboard, the AutoDesk Viewer on the left, a live dygraph time-series chart and stats table on the right, refreshing every 60 seconds. The data-flow diagram above shows how the pieces connect; the live app needs your own APS credentials and a Tandem facility.
Warning
The Shiny server fetches Tandem data from R, not from the user’s browser, so CORS restrictions don’t apply. The server process does need outbound HTTPS access to tandem.autodesk.com, so check this if you’re deploying on a restricted corporate network.
18.6 Deploying to shinyapps.io
Keep credentials out of the app source. Pass them as server environment variables at deploy time:
library(rsconnect)

deployApp(
  appDir     = ".",
  appName    = "twin-dashboard",
  appEnvVars = list(
    client_id     = Sys.getenv("client_id"),
    client_secret = Sys.getenv("client_secret"),
    urn           = Sys.getenv("urn")
  )
)