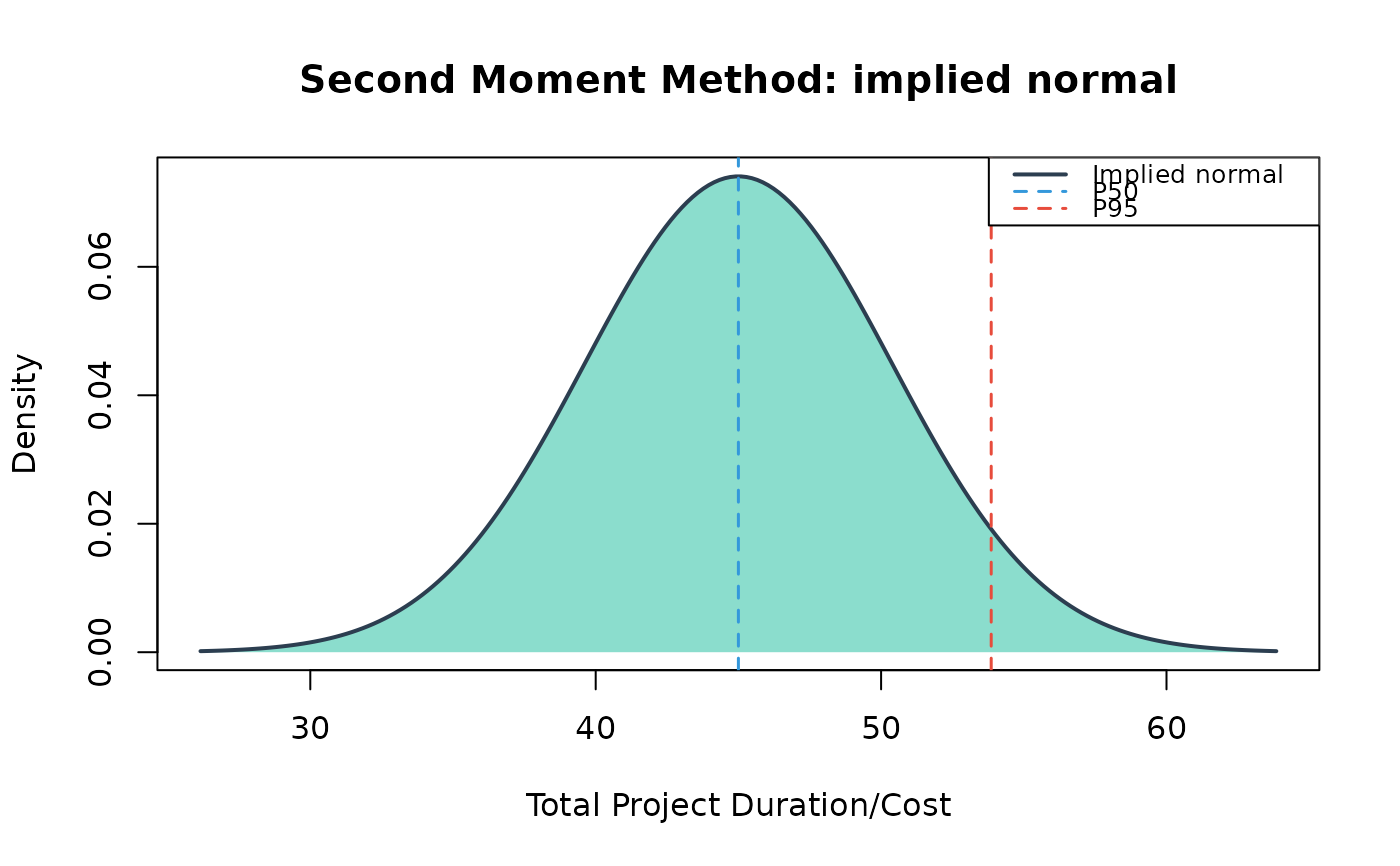
Displays the normal density implied by the propagated mean and standard deviation, with the P50 and P95 percentiles marked.
Usage
# S3 method for class 'smm'
plot(x, main = NULL, col = NULL, xlab = NULL, ...)
Arguments
- x
An object of class
"smm".- main
Optional plot title. If
NULL, a default title is generated.- col
Fill color under the density curve. If
NULL, uses the package palette.- xlab
Optional x-axis label.
- ...
Additional arguments passed to
graphics::plot().
Details
The Second Moment Method constrains only two moments, so this curve is the
maximum-entropy distribution consistent with them rather than an estimate of
the true distribution's shape. The left tail is an artifact when
total_mean is less than roughly three standard deviations, since costs and
durations are non-negative and the normal is not. Use plot.mcs() on a
mcs() result when the shape matters.