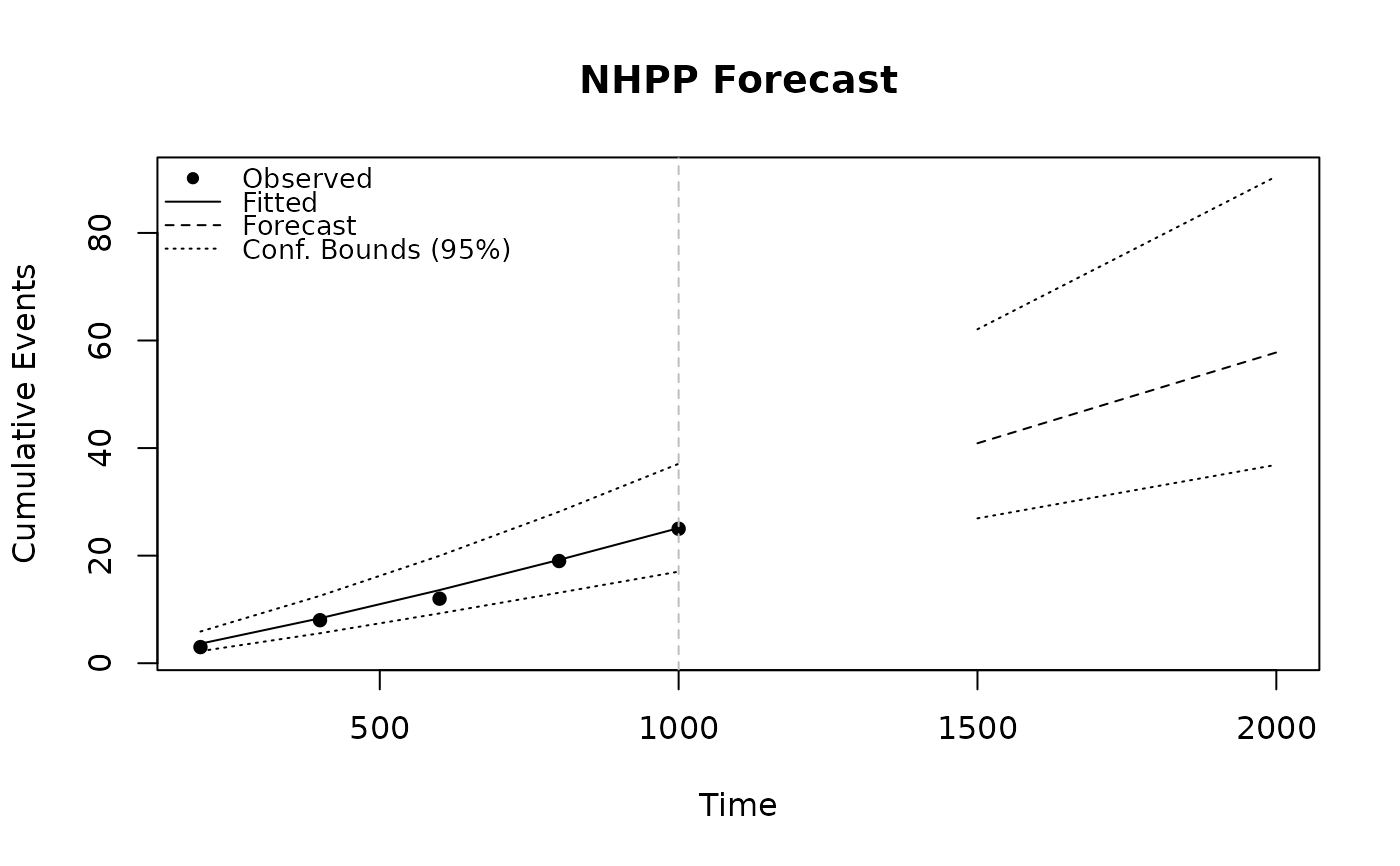
Plots observed data, fitted model, and forecast with optional confidence bounds.
Usage
# S3 method for class 'nhpp_predict'
plot(x, conf_bounds = TRUE, legend = TRUE, legend_pos = "topleft", ...)
Arguments
- x
An object of class
nhpp_predict.- conf_bounds
Logical; include confidence bounds (default: TRUE).
- legend
Logical; show the legend (default: TRUE).
- legend_pos
Position of the legend (default: "topleft").
- ...
Additional arguments passed to
plot().
See also
Other Repairable Systems Analysis:
exposure(),
mcf(),
nhpp(),
overlay_nhpp(),
plot.exposure(),
plot.mcf(),
plot.nhpp(),
predict_nhpp(),
print.exposure(),
print.mcf(),
print.nhpp(),
print.nhpp_predict()