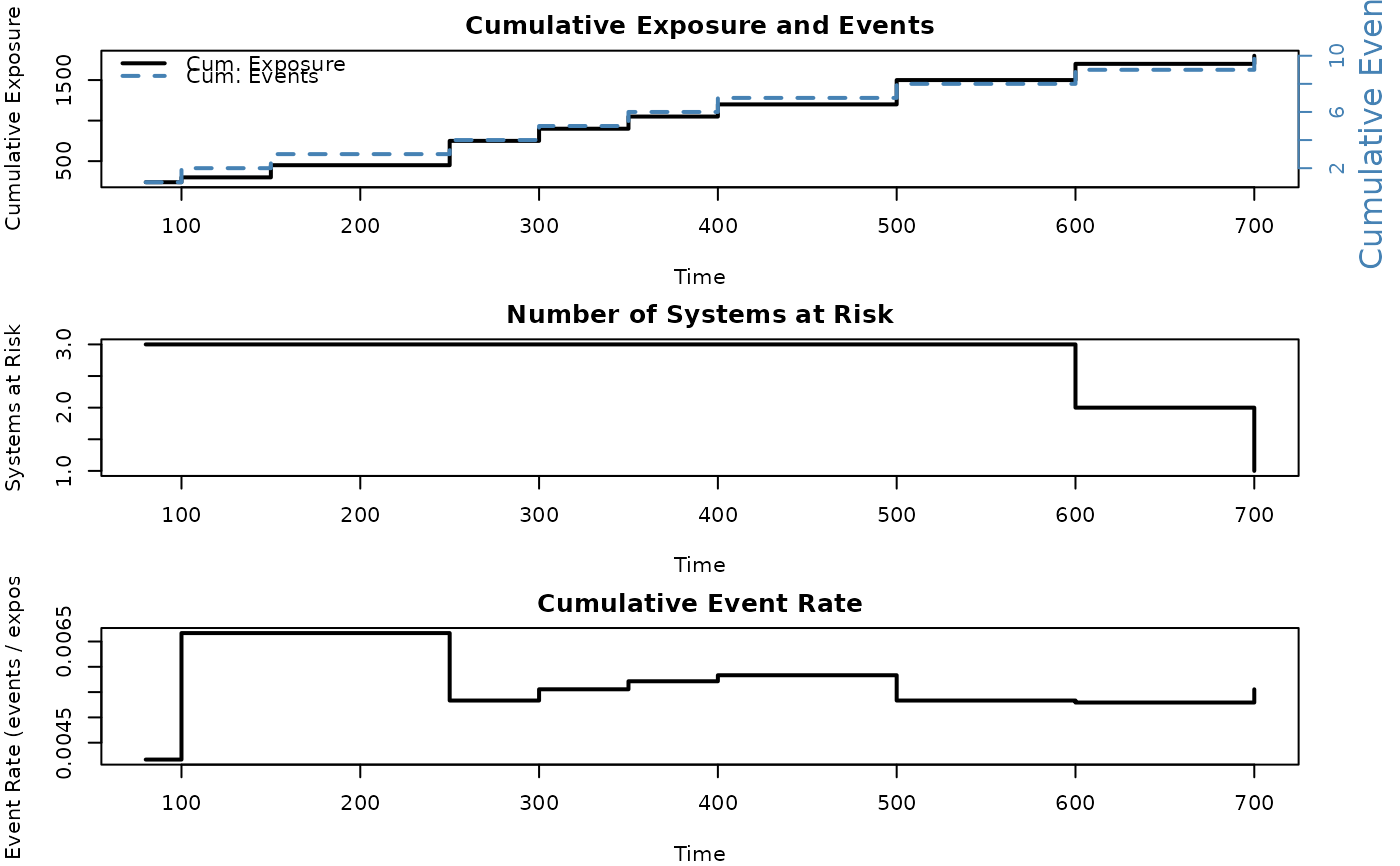
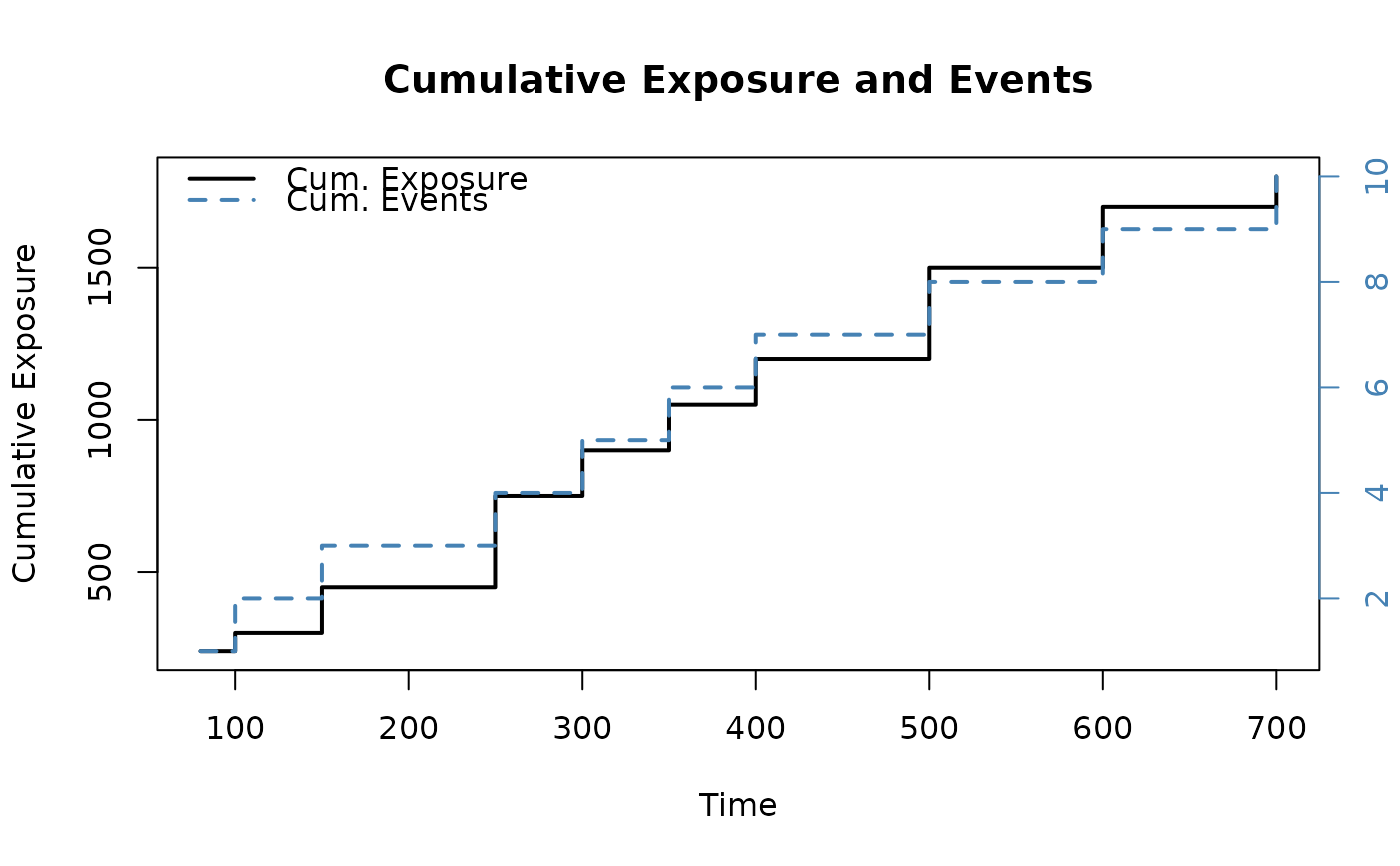
Produces a multi-panel plot of exposure analysis results. The default
layout shows cumulative exposure and cumulative events versus time
(top panel), the number of systems at risk over time (middle panel),
and the event rate over time (bottom panel). Alternatively, a single
which panel can be selected.
Arguments
- x
An object of class
exposure.- which
Character string selecting which panel(s) to plot. One of
"all"(default),"exposure","at_risk", or"event_rate".- legend
Logical; show the legend (default: TRUE).
- legend_pos
Position of the legend (default: "topleft").
- ...
Additional arguments passed to the underlying
plot().
See also
Other Repairable Systems Analysis:
exposure(),
mcf(),
nhpp(),
overlay_nhpp(),
plot.mcf(),
plot.nhpp(),
plot.nhpp_predict(),
predict_nhpp(),
print.exposure(),
print.mcf(),
print.nhpp(),
print.nhpp_predict()