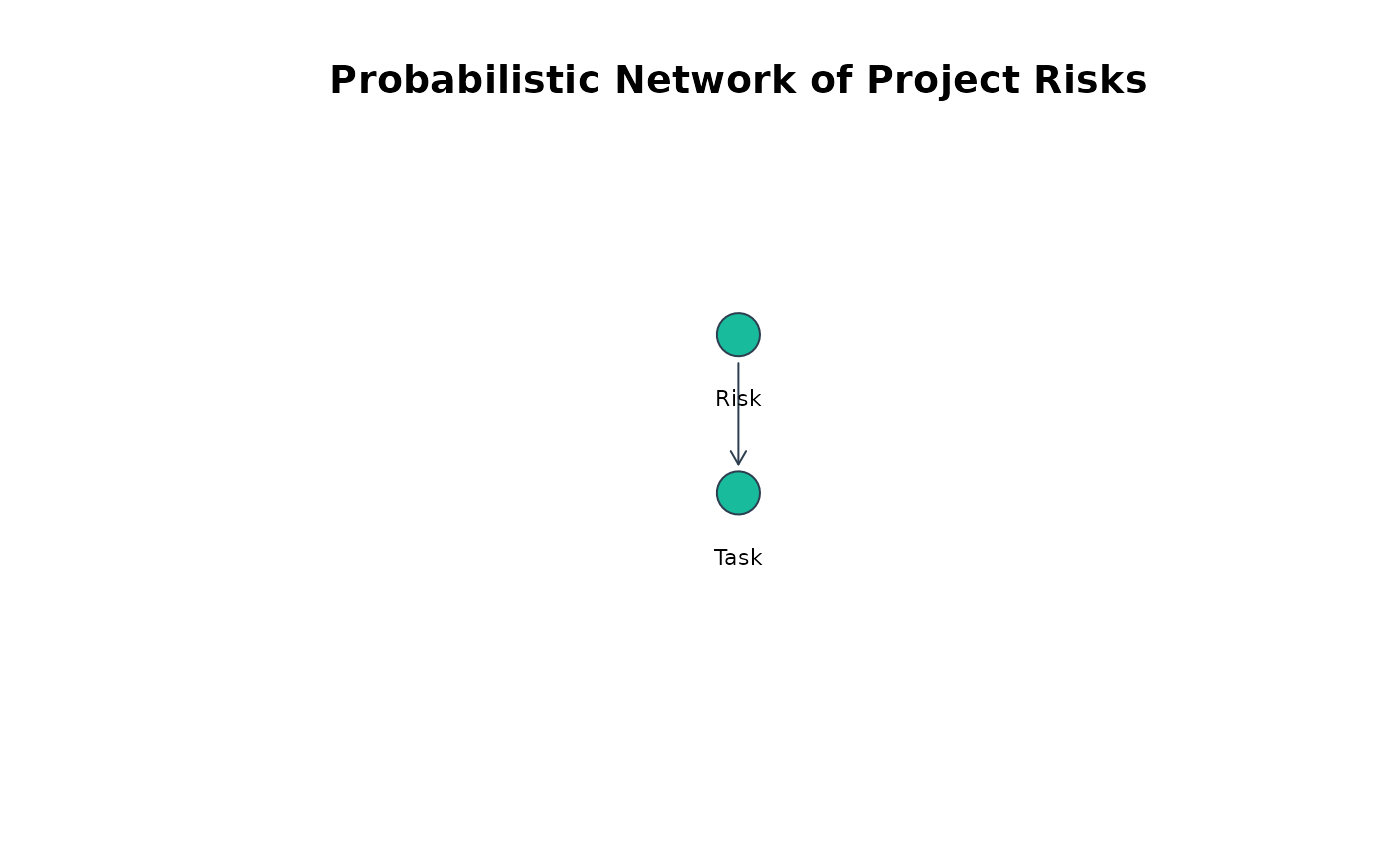
Draws the network as a layered directed graph: nodes are placed by their longest-path distance from a root, so causes sit above the effects they propagate into. Within-layer ordering is refined by barycenter sweeps to reduce edge crossings.
Usage
# S3 method for class 'prob_net'
plot(
  x,
  main = NULL,
  col = NULL,
  vertical = TRUE,
  node_cex = 3,
  label_cex = 0.7,
  ...
)
Arguments
- x
An object of class
"prob_net".- main
Optional plot title. If
NULL, a default title is generated.- col
Node fill color or vector of colors. If
NULL, nodes are colored by theirgroupcolumn when present, and uniformly otherwise.- vertical
Logical. If
TRUE(default), layers run top to bottom; otherwise left to right.- node_cex
Node symbol size, passed to
graphics::points().- label_cex
Node label size, passed to
graphics::text().- ...
Additional arguments passed to
graphics::plot().
Details
This is a readable layout for the small-to-moderate networks the module is
designed for, implemented in base graphics so that no optional dependency is
required. It does not route long edges around intervening layers the way a
full Sugiyama implementation does. For large or dense graphs, pass the
network to a dedicated graph package, for example
igraph::graph_from_data_frame(x$links, vertices = x$nodes).
Examples
nodes <- data.frame(id = c("Risk", "Task"), stringsAsFactors = FALSE)
links <- data.frame(source = "Risk", target = "Task", stringsAsFactors = FALSE)
dists <- list(
  Risk = list(type = "discrete", values = c(0, 1), probs = c(0.7, 0.3)),
  Task = list(
    type = "conditional", condition = "Risk",
    true_dist = list(type = "normal", mean = 20, sd = 4),
    false_dist = list(type = "normal", mean = 10, sd = 2)
  )
)
plot(prob_net(nodes, links, distributions = dists))