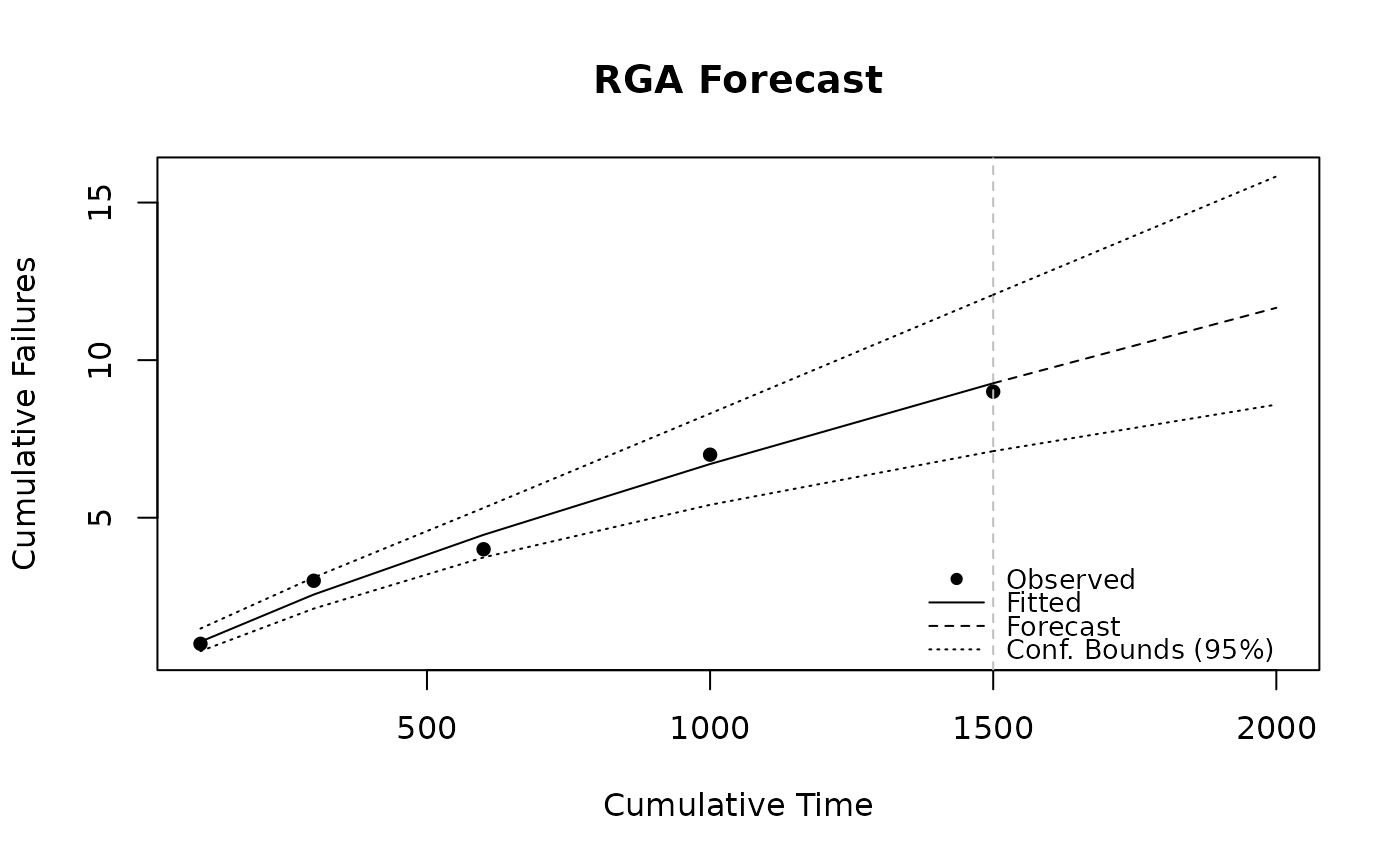
Plots observed data, the fitted reliability growth curve, and the forecast
with optional confidence bounds for an rga_predict object.
Usage
# S3 method for class 'rga_predict'
plot(x, conf_bounds = TRUE, legend = TRUE, legend_pos = "bottomright", ...)
Arguments
- x
An object of class
rga_predict.- conf_bounds
Logical; include confidence bounds (default:
TRUE).- legend
Logical; show the legend (default:
TRUE).- legend_pos
Position of the legend (default:
"bottomright").- ...
Additional arguments passed to
plot().
See also
Other Reliability Growth Analysis:
overlay_rga(),
plot.rga(),
predict_rga(),
print.rga(),
print.rga_predict(),
rga()
Examples
times <- c(100, 200, 300, 400, 500)
failures <- c(1, 2, 1, 3, 2)
fit <- rga(times, failures)
fc <- predict_rga(fit, times = c(1500, 2000))
#> Warning: Some 'times' values are <= the maximum observed cumulative time. Hindcasting is allowed but may not be meaningful.
plot(fc, main = "RGA Forecast", xlab = "Cumulative Time", ylab = "Cumulative Failures")