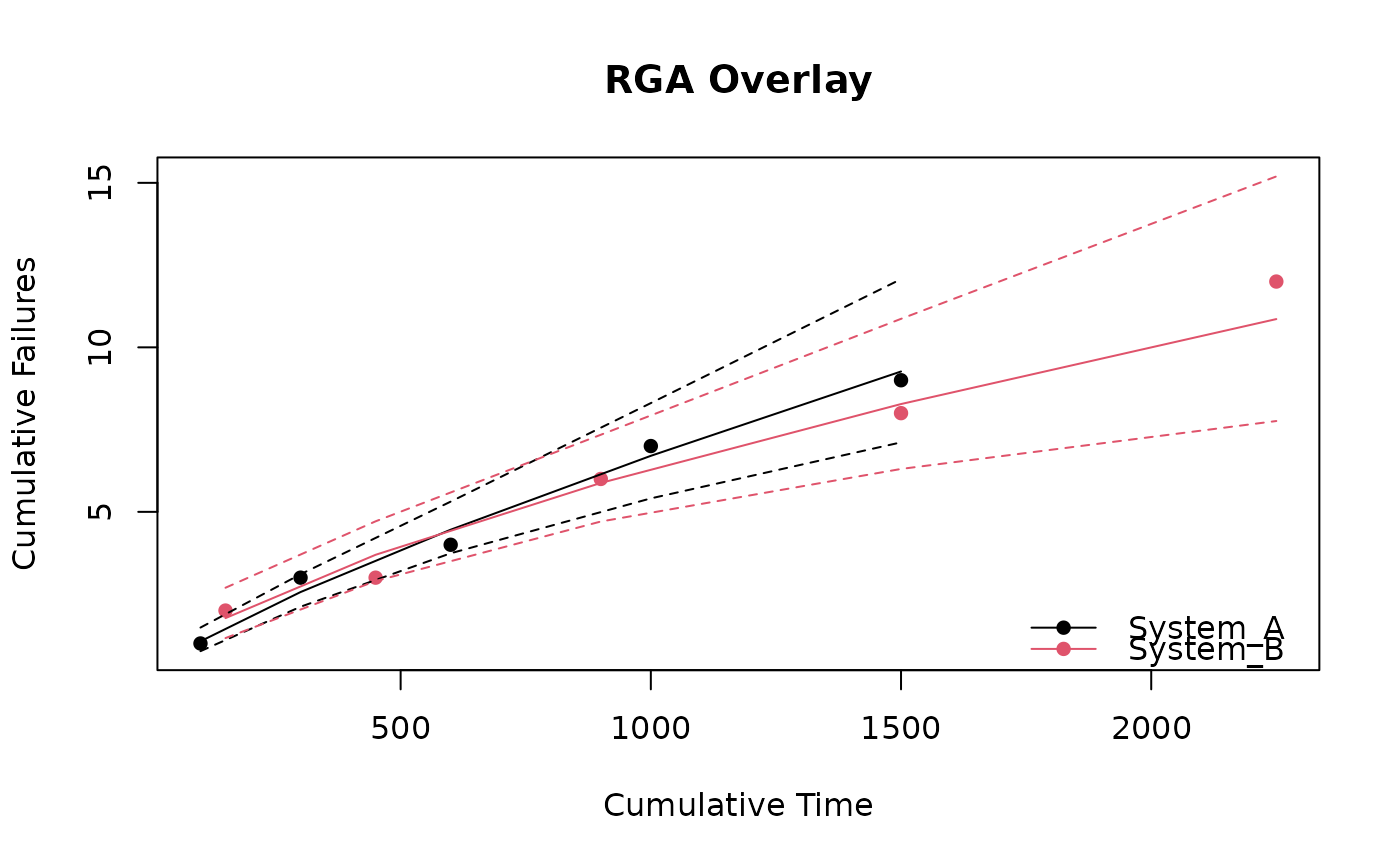
Plots multiple fitted rga objects on a single set of axes, using
distinct colors per model. Observed data points, fitted lines, and optional
confidence bounds are drawn for every model. Models may have been fit to
different datasets.
Usage
overlay_rga(
  models,
  conf_bounds = TRUE,
  legend = TRUE,
  legend_pos = "bottomright",
  colors = NULL,
  log = FALSE,
  ...
)
Arguments
- models
A named or unnamed list of objects of class
rga. At least one model must be provided. If the list is named, those names are used as legend labels; otherwise labels default to"Model 1","Model 2", etc.- conf_bounds
Logical; draw confidence bounds for each model (default:
TRUE).- legend
Logical; draw a legend (default:
TRUE).- legend_pos
Legend position keyword (default:
"bottomright").- colors
Optional character vector of colors, one per model. If
NULL(default),palette()colors are cycled.- log
Logical; use log-log axes (default:
FALSE).- ...
Additional arguments passed to the initial
plot()call (e.g.,main,xlab,ylab). Not forwarded to subsequentlines()orpoints()calls.
See also
Other Reliability Growth Analysis:
plot.rga(),
plot.rga_predict(),
predict_rga(),
print.rga(),
print.rga_predict(),
rga()