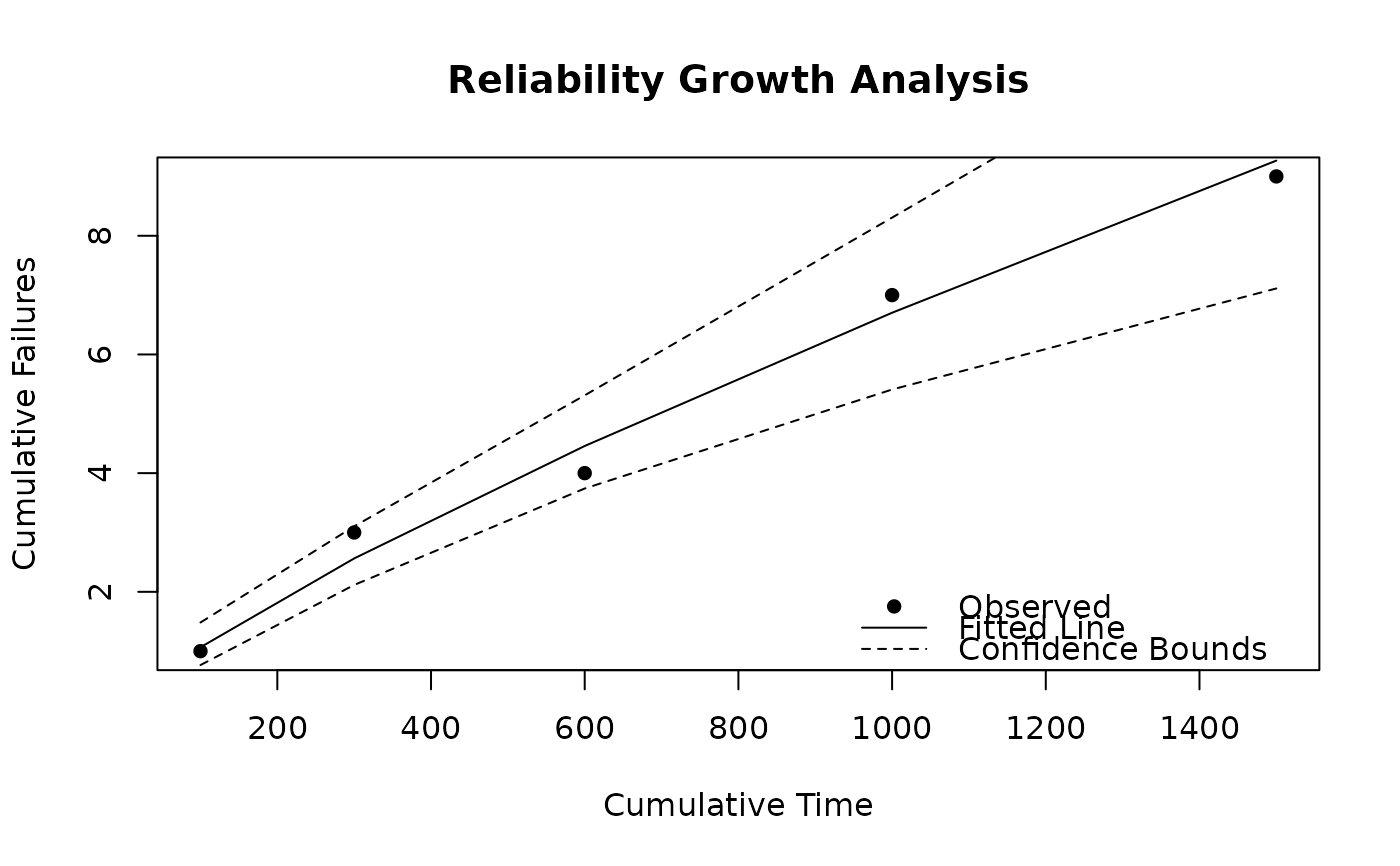
This function generates plots for objects of class rga.
Usage
# S3 method for class 'rga'
plot(
  x,
  conf_bounds = TRUE,
  legend = TRUE,
  log = FALSE,
  legend_pos = "bottomright",
  ...
)
Arguments
- x
An object of class
rga, which contains the results from the RGA model.- conf_bounds
Logical; include confidence bounds (default: TRUE).
- legend
Logical; show the legend (default: TRUE).
- log
Logical; use a log-log scale (default: FALSE).
- legend_pos
Position of the legend (default: "bottomright").
- ...
Additional arguments passed to
plot().
See also
Other Reliability Growth Analysis:
overlay_rga(),
plot.rga_predict(),
predict_rga(),
print.rga(),
print.rga_predict(),
rga()