This function performs sensitivity analysis on a project with multiple tasks, each having its own cost distribution. It calculates the sensitivity of the variance in total project cost with respect to the variance in each task's cost. It can also account for correlations between task costs if a correlation matrix is provided.
Arguments
- task_dists
A list of lists describing each task distribution. Each inner list should contain the type of distribution and its parameters. Supported distributions are "normal", "triangular", and "uniform".
- cor_mat
The correlation matrix for the tasks (Optional). If provided, it should be a square matrix with dimensions equal to the number of tasks. If not provided, tasks are assumed to be independent.
Value
The function returns a vector of sensitivity results with respect to each task. Each element in the vector corresponds to the sensitivity of the variance in total project cost with respect to the variance in the respective task's cost.
References
Damnjanovic, Ivan, and Kenneth Reinschmidt. Data analytics for engineering and construction project risk management. No. 172534. Cham, Switzerland: Springer, 2020.
Examples
# Set the task distributions for a toy project.
task_dists <- list(
  list(type = "normal", mean = 10, sd = 2), # Task A: Normal distribution
  list(type = "triangular", a = 5, b = 15, c = 10), # Task B: Triangular distribution
  list(type = "uniform", min = 8, max = 12) # Task C: Uniform distribution
)

# Set the correlation matrix between the tasks.
cor_mat <- matrix(c(
  1, 0.5, 0.3,
  0.5, 1, 0.4,
  0.3, 0.4, 1
), nrow = 3, byrow = TRUE)

# Calculate the sensitivity of each task and print the results
sensitivity_results <- sensitivity(task_dists, cor_mat)
print(sensitivity_results)
#> [1] 2.6 2.8 2.4

# Build a vertical barchart and display the results.
data <- data.frame(
  Tasks = c("A", "B", "C"),
  Sensitivity = sensitivity_results
)
barplot(
  height = data$Sensitivity, names = data$Tasks, col = "skyblue",
  horiz = TRUE, xlab = "Sensitivity", ylab = "Tasks"
)
title("Sensitivity Analysis of Project Tasks")


# Without correlation matrix
sensitivity_results_indep <- sensitivity(task_dists)
print(sensitivity_results_indep)
#> [1] 1 1 1

# Build a vertical barchart and display the results.
data_indep <- data.frame(
  Tasks = c("A", "B", "C"),
  Sensitivity = sensitivity_results_indep
)
barplot(
  height = data_indep$Sensitivity, names = data_indep$Tasks,
  col = "lightgreen",
  horiz = TRUE, xlab = "Sensitivity", ylab = "Tasks"
)
title("Sensitivity Analysis of Project Tasks (Independent)")
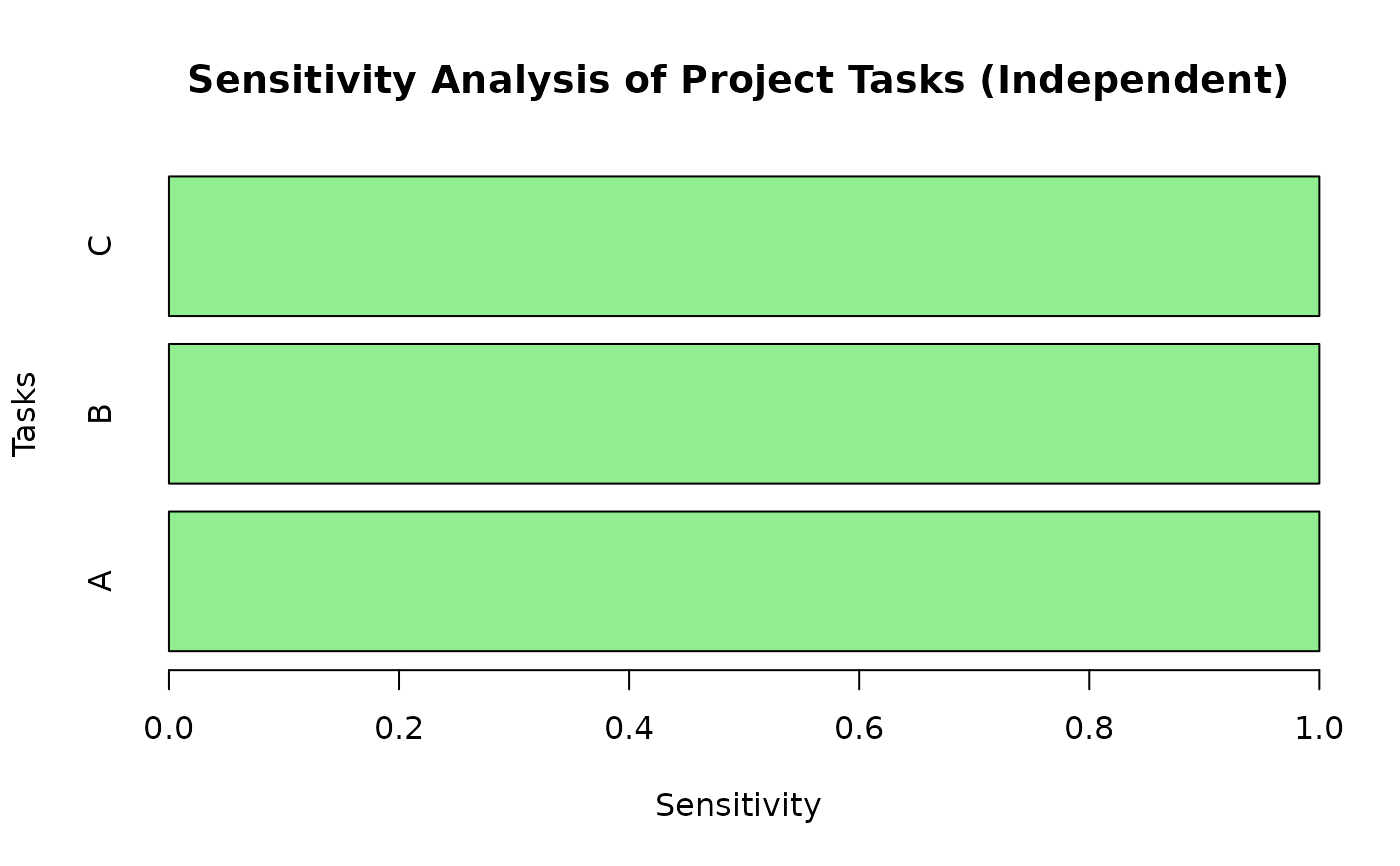
# Without correlation matrix
sensitivity_results_indep <- sensitivity(task_dists)
print(sensitivity_results_indep)
#> [1] 1 1 1
# Build a vertical barchart and display the results.
data_indep <- data.frame(
Tasks = c("A", "B", "C"),
Sensitivity = sensitivity_results_indep
)
barplot(
height = data_indep$Sensitivity, names = data_indep$Tasks,
col = "lightgreen",
horiz = TRUE, xlab = "Sensitivity", ylab = "Tasks"
)
title("Sensitivity Analysis of Project Tasks (Independent)")