This function generates random samples from the posterior distribution of the cost 'A' given observations of multiple risk events 'R_i'. Each risk event has its own mean and standard deviation for the cost distribution. The function also accounts for a baseline cost when no risk event occurs.
Usage
cost_post_pdf(
  num_sims,
  observed_risks,
  means_given_risks,
  sds_given_risks,
  base_cost = 0,
  risk_probs = NULL
)
Arguments
- num_sims
Number of random samples to draw from the posterior distribution.
- observed_risks
A vector of observed values for each risk event 'R_i' (1 if observed, 0 if not observed, NA if unobserved).
- means_given_risks
A vector of means of the normal distribution for cost 'A' given each risk event 'R_i'.
- sds_given_risks
A vector of standard deviations of the normal distribution for cost 'A' given each risk event 'R_i'.
- base_cost
The baseline cost given no risk event occurs.
- risk_probs
Optional vector of prior probabilities for each risk event, used to draw the risks left unobserved (
NA) inobserved_risks. IfNULL(default), unobserved risks are treated as not occurring and a warning is issued.
Details
An observed risk is fixed: a risk observed to have occurred always
contributes its cost, and one observed not to have occurred never does. An
unobserved risk (NA) is drawn from its prior probability when risk_probs
is supplied, which is the same treatment risk_post_prob() gives an
unobserved cause. When risk_probs is NULL there is no prior to draw from,
so unobserved risks contribute nothing and the result is a posterior over the
observed risks alone; the function warns in that case, because ignoring an
unobserved risk understates the cost.
References
Damnjanovic, Ivan, and Kenneth Reinschmidt. Data analytics for engineering and construction project risk management. No. 172534. Cham, Switzerland: Springer, 2020.
Examples
# Example with three risk events
num_sims <- 1000
observed_risks <- c(1, NA, 1)
means_given_risks <- c(10000, 15000, 5000)
sds_given_risks <- c(2000, 1000, 1000)
base_cost <- 2000
# The second risk is unobserved, so it is drawn from its prior probability.
posterior_samples <- cost_post_pdf(
  num_sims = num_sims,
  observed_risks = observed_risks,
  means_given_risks = means_given_risks,
  sds_given_risks = sds_given_risks,
  base_cost = base_cost,
  risk_probs = c(0.3, 0.5, 0.2)
)
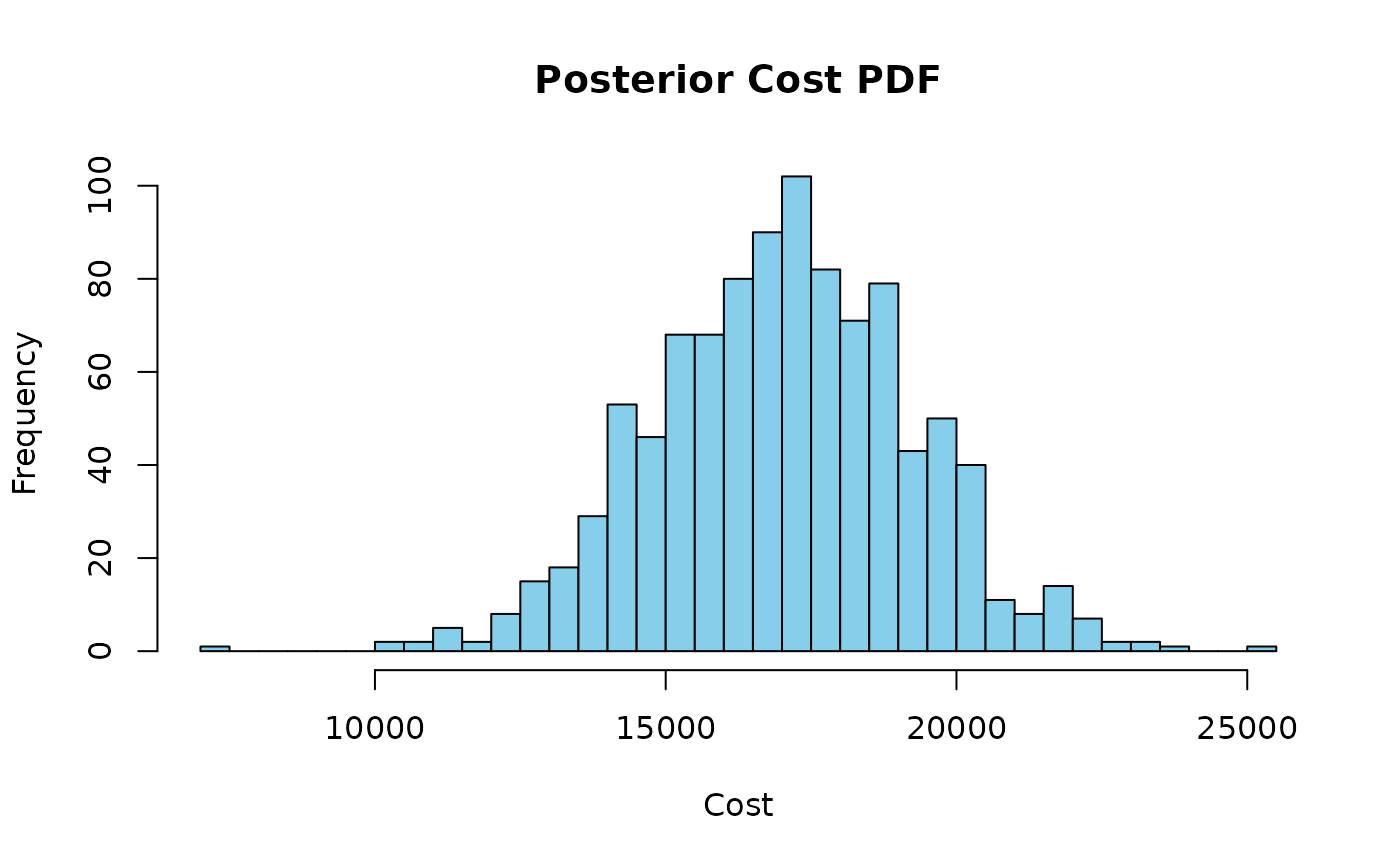
hist(posterior_samples, breaks = 30, col = "skyblue", main = "Posterior Cost PDF", xlab = "Cost")