This function generates random samples from a mixture model representing the cost 'A' associated with multiple risk events 'R_i'. Each risk event has its own probability, mean, and standard deviation for the cost distribution. The function also accounts for a baseline cost when no risk event occurs.
Arguments
- num_sims
Number of random samples to draw from the mixture model.
- risk_probs
A vector of probabilities for each risk event 'R_i'. The risks are independent, so these need not sum to 1.
- means_given_risks
A vector of means of the normal distribution for cost 'A' given each risk event 'R_i'.
- sds_given_risks
A vector of standard deviations of the normal distribution for cost 'A' given each risk event 'R_i'.
- base_cost
The baseline cost given no risk event occurs.
Details
The risk events are independent Bernoulli draws, so any number of
them may occur in the same simulation and their probabilities need not sum to
one. Each risk that occurs contributes a normal cost on top of base_cost.
References
Damnjanovic, Ivan, and Kenneth Reinschmidt. Data analytics for engineering and construction project risk management. No. 172534. Cham, Switzerland: Springer, 2020.
Examples
# Example with three risk events
num_sims <- 1000
risk_probs <- c(0.3, 0.5, 0.2)
means_given_risks <- c(10000, 15000, 5000)
sds_given_risks <- c(2000, 1000, 1000)
base_cost <- 2000
samples <- cost_pdf(
  num_sims = num_sims,
  risk_probs = risk_probs,
  means_given_risks = means_given_risks,
  sds_given_risks = sds_given_risks,
  base_cost = base_cost
)
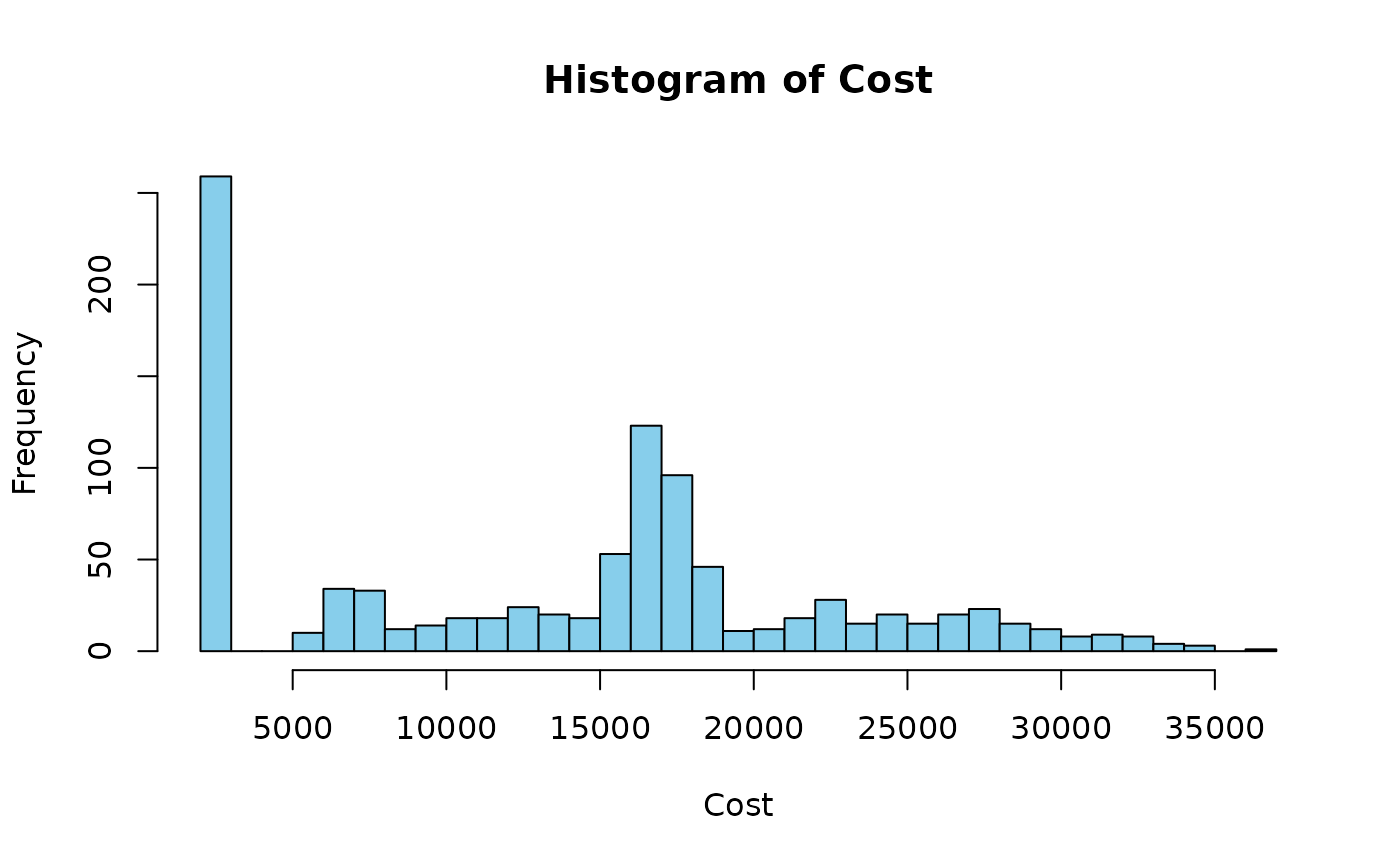
hist(samples, breaks = 30, col = "skyblue", main = "Histogram of Cost", xlab = "Cost")