Build interactive reliability plots with plotly, an interactive web-based graphing library. ReliaPlotR wraps the WeibullR, WeibullR.ALT, and ReliaGrowR packages to produce interactive visualizations across four reliability analysis domains.
Function Overview
| Function | Analysis Domain | Purpose |
|---|---|---|
plotly_wblr() |
Life Data Analysis | Weibull/lognormal probability plot |
plotly_contour() |
Life Data Analysis | MLE parameter confidence contour plot |
plotly_alt() |
Accelerated Life Testing | ALT probability plot (one line per stress level) |
plotly_rel() |
Accelerated Life Testing | ALT life-stress relationship plot |
plotly_rga() |
Reliability Growth | Crow-AMSAA / NHPP cumulative failures plot |
plotly_duane() |
Reliability Growth | Duane cumulative MTBF plot (log-log) |
plotly_nhpp() |
Repairable Systems | NHPP MCF plot with parametric model overlay |
plotly_mcf() |
Repairable Systems | Nonparametric Mean Cumulative Function plot |
plotly_exposure() |
Repairable Systems | Cumulative event rate (exposure) plot |
All functions accept a single model object or a list of objects for overlay plots, and return a plotly object for interactive use.
Getting Started
To install ReliaPlotR in R:
install.packages("ReliaPlotR")Or install the development version:
devtools::install_github("paulgovan/ReliaPlotR")Basic Examples
To build a probability plot, first fit a wblr object using the WeibullR package and then use plotly_wblr to build the plot.
library(WeibullR)
library(ReliaPlotR)
failures <- c(30, 49, 82, 90, 96)
obj <- wblr.conf(wblr.fit(wblr(failures)))
plotly_wblr(obj)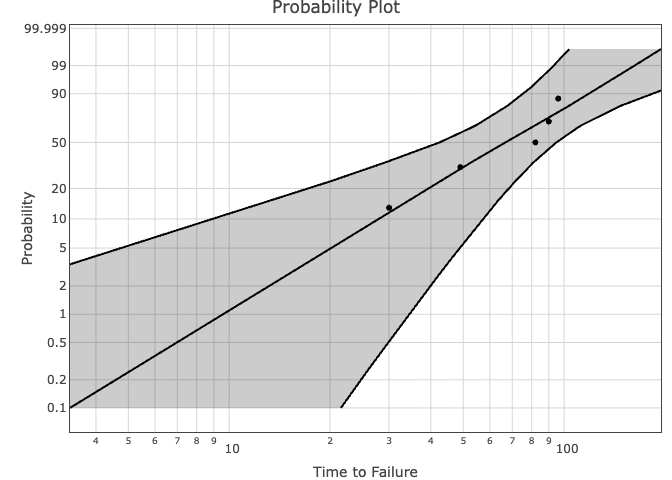
To build a contour plot, use the plotly_contour function. Note that contour plots are only available where method.fit='mle' and method.conf='lrb'.
obj <- wblr.conf(wblr.fit(wblr(failures), method.fit = "mle"), method.conf = "lrb")
plotly_contour(obj)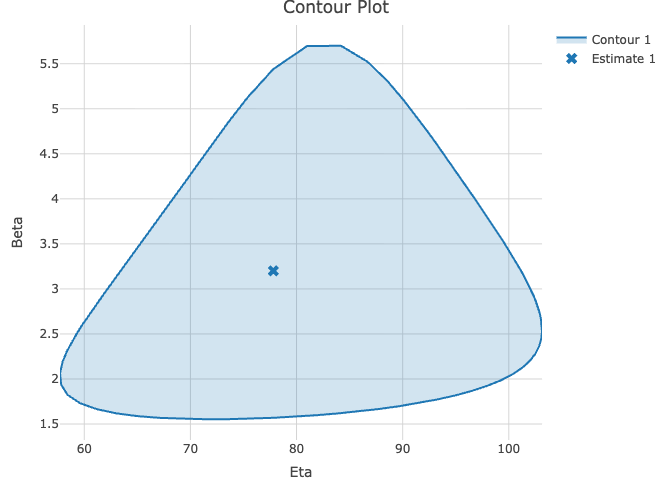
Customization
ReliaPlotR has several customization options.
plotly_wblr(obj, main = "Weibull Probability Plot", xlab = "Years", ylab = "Failure Probability", confCol = "blue", signif = 4, grid = FALSE)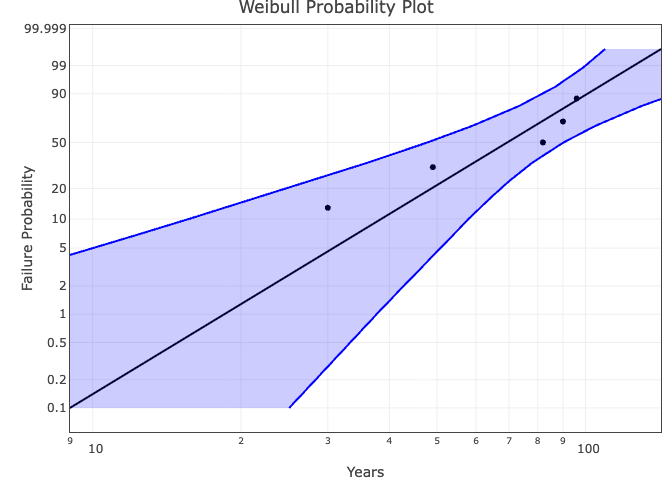
plotly_contour(obj, main = "Weibull Contour Plot", col = "red", signif = 4, grid = FALSE)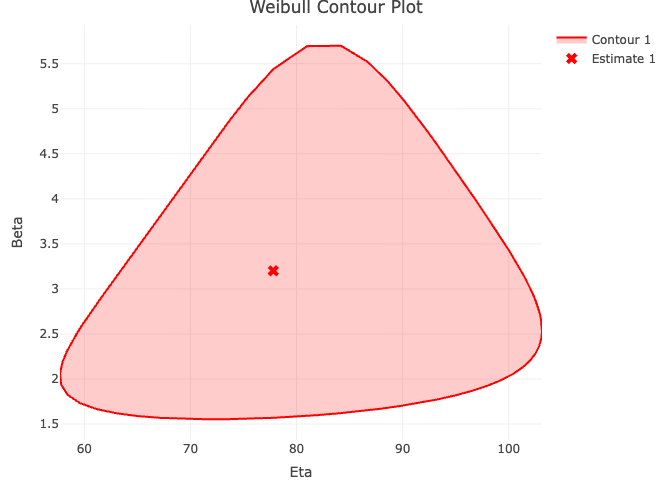
Code of Conduct
Please note that the ReliaPlotR project is released with a Contributor Code of Conduct. By contributing to this project, you agree to abide by its terms.