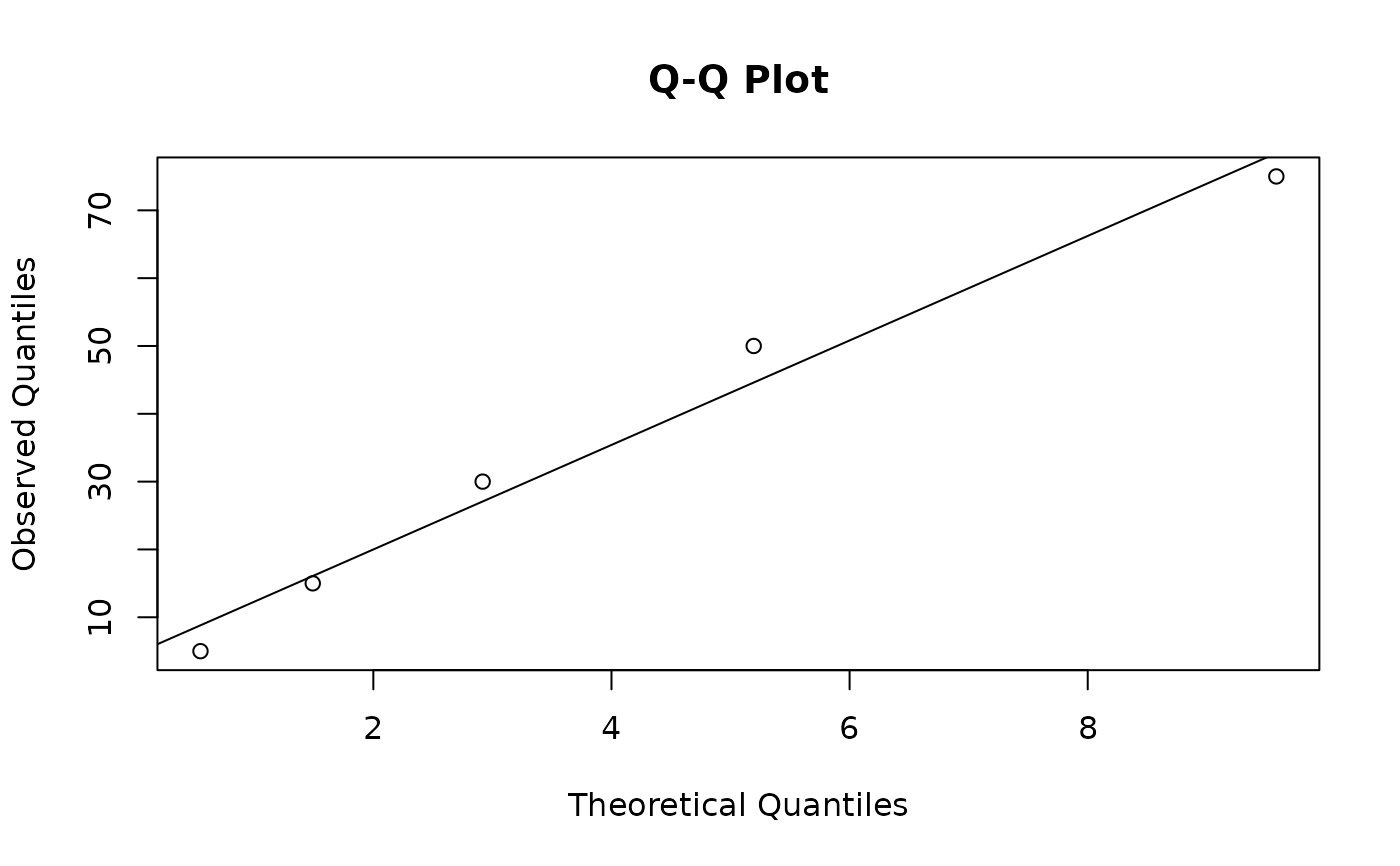
This function creates a Q-Q plot for a fitted Reliability Growth Analysis (RGA) model Currently only supports the Crow-AMSAA model. A Q-Q plot compares the quantiles of the empirical data to the quantiles of the theoretical distribution specified by the model. If the model fits well, the points should fall approximately along a straight line.
Arguments
- x
An object of class
rga.- main
Title of the plot.
- ...
Additional arguments passed to
stats::qqplot().
See also
Other goodness-of-fit:
gof(),
ppplot.rga(),
print.gof()