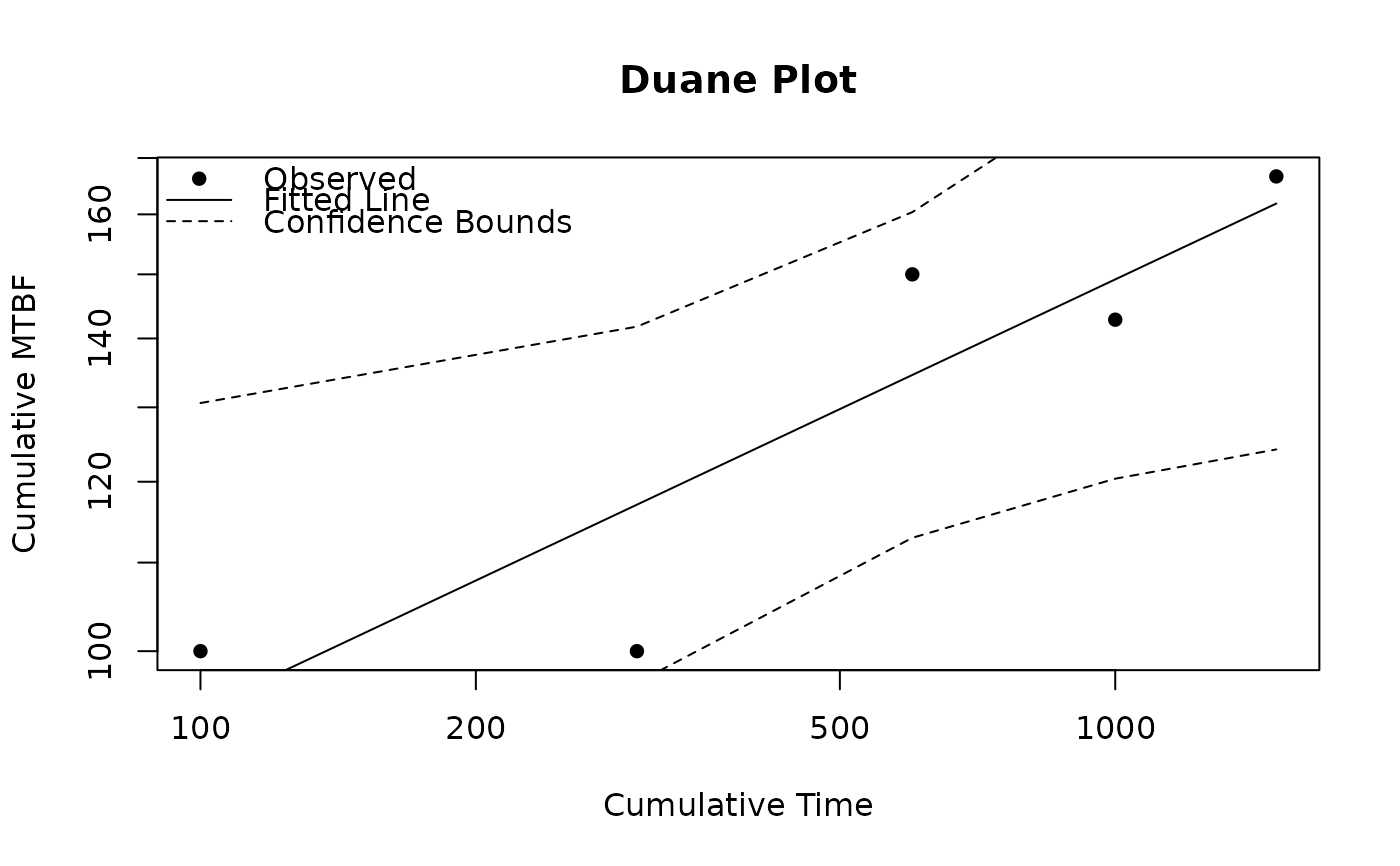
Generates a Duane plot (log-log or linear scale) with fitted regression line and optional confidence bounds.
Usage
# S3 method for class 'duane'
plot(
  x,
  log = TRUE,
  conf_bounds = TRUE,
  legend = TRUE,
  legend_pos = "topleft",
  conf.int = NULL,
  legend.pos = NULL,
  ...
)
Arguments
- x
An object of class
"duane".- log
Logical; whether to use logarithmic scales for axes (default:
TRUE).- conf_bounds
Logical; whether to plot confidence bounds (default:
TRUE).- legend
Logical; whether to include a legend (default: TRUE).
- legend_pos
Position of the legend (default: "topleft").
- conf.int
Deprecated. Use
conf_boundsinstead.- legend.pos
Deprecated. Use
legend_posinstead.- ...
Further arguments passed to
plot().
See also
Other Duane functions:
duane(),
plot.duane_predict(),
predict_duane(),
print.duane(),
print.duane_predict()