Features
- Easily create Quantitative Risk Analysis (QRA) visualizations
- Choose from numerous color palettes, basemaps, and different configurations
Overview
QRAGadget is a Shiny Gadget for creating interactive QRA visualizations. QRAGadget is powered by the excellent leaflet and raster packages. While this gadget was initially intended for those interested in creating QRA visualizations, it may also be more generally applicable to anyone interested in visualizing raster data in an interactive map.
Installation
To install QRAGadget in R:
install.packages("QRAGadget")Or to install the latest development version:
devtools::install_github("paulgovan/QRAGadget")After installation, and if using RStudio (v0.99.878 or later), the gadget will appear in the Addins dropdown menu. Otherwise, to launch the gadget, simply type:
QRAGadget::QRAGadget()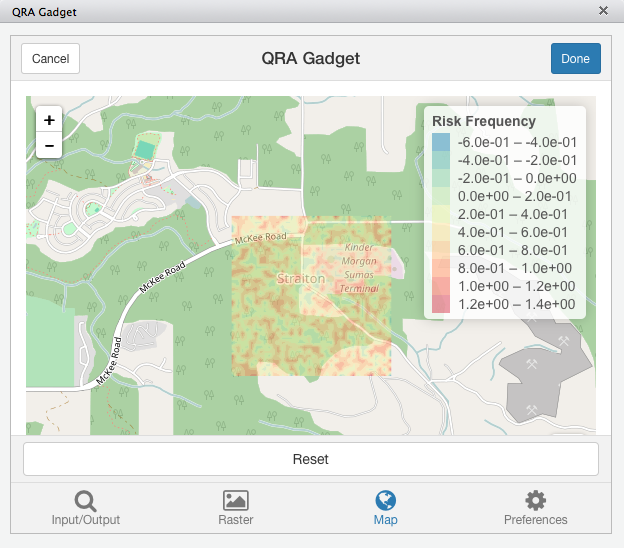
Code of Conduct
Please note that the QRAGadget project is released with a Contributor Code of Conduct. By contributing to this project, you agree to abide by its terms.