
A Shiny web application for life data analysis that depends on WeibullR, an R package for Weibull analysis.
Getting Started
To install WeibullR.shiny in R:
install.packages("WeibullR.shiny")To install the development version:
devtools::install_github('paulgovan/weibullr.shiny')To launch the app:
WeibullR.shiny::WeibullR.shiny()Or to access the app through a browser, visit paulgovan.shinyapps.io/WeibullRshiny.
Example
Landing
Launching the app brings up the Landing tab. From here you can access this ReadMe, download an example dataset, or navigate to the Data tab.
Data
For this example, we will use the example ‘Time-to-Failure’ dataset. To access, first download the dataset locally from the Landing tab, and then use the Data Input option in the Data tab to upload the dataset to the app. At this point, your app should look like the image below. There are additional options for arranging your data for analysis, but for here we will use the default option.

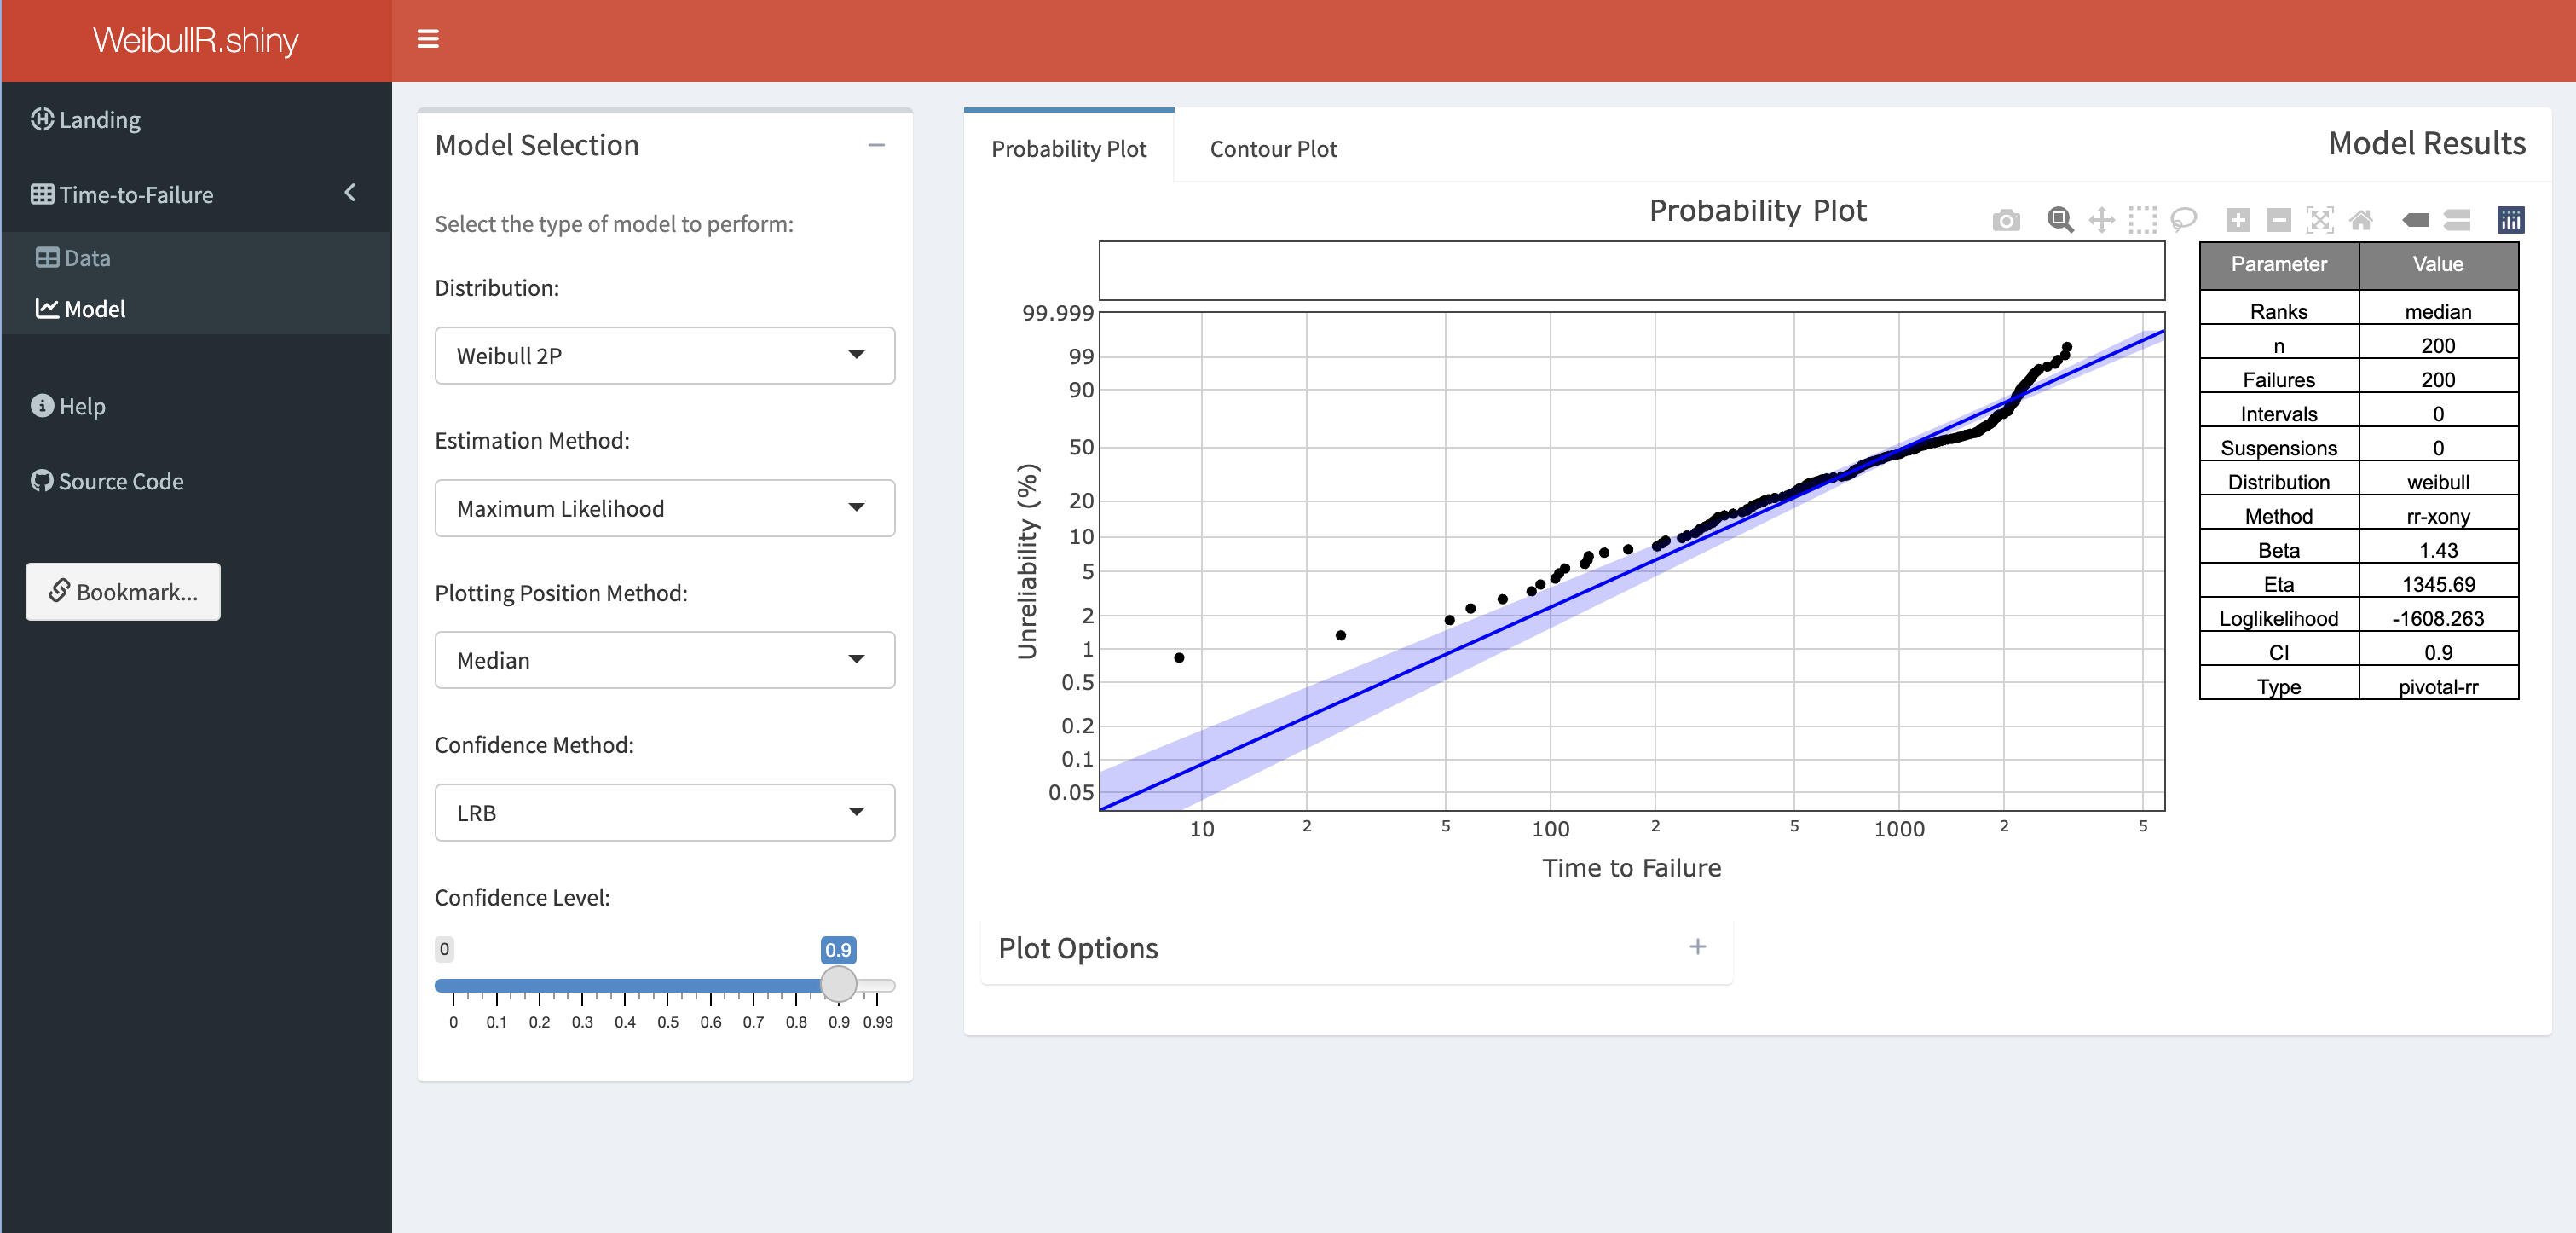
Modeling
Now click on the Modeling tab to build the model. The app will use the default options to build a Probability Plot. Feel free to try different options to configure the model. Below the plot are additional plot options to configure the plot.
Finally, click on the Contour Plot tab to build a contour plot. As before, there are other plot options for configuring the contour plot.

Code of Conduct
Please note that the WeibullR.shiny project is released with a Contributor Code of Conduct. By contributing to this project, you agree to abide by its terms.
More Resources
For more info on WeibullR.plotly, visit WeibullR.plotly
For an interactive introduction to Life Data Analysis, check out WeibullR.learnr